Fig. 4
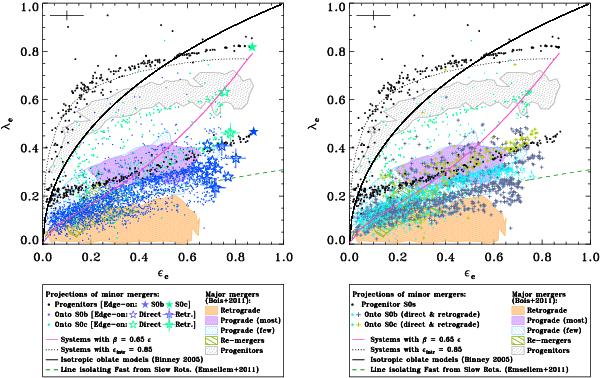
The λe – ϵe diagram for 200 random projections of our remnants and the original S0 galaxies, now compared with the distribution of the remnants resulting in major and intermediate merger simulations by B11. The symbols represent the projections of the remnants of our dry intermediate and minor mergers, following the same legend as in the panels of Fig. 2. The locations of the remnants by B11 are plotted with contours for their fast-rotator remnants resulting in prograde encounters (purple and light blue, see Fig. 7 in B11 and Fig. 16 in E11), slow-rotator remnants from their retrograde mergers (orange, from Fig. 2 in B11), re-merger remnants (green, see their Fig. 8), and their spiral progenitors (grey, from their Fig. 1). The region in purple denotes where most fast-rotator remnants from major merger simulations by B11 are located, while the one in light blue is only reached under very specific projections of these remnants. Left panel: for all our models, independently of their spin-orbit coupling. Right panel: the same as in the left panel, but distinguishing between prograde and retrograde encounters. The lines and symbols represent the same as in Fig. 2. (This figure is available in color in electronic form.)
Current usage metrics show cumulative count of Article Views (full-text article views including HTML views, PDF and ePub downloads, according to the available data) and Abstracts Views on Vision4Press platform.
Data correspond to usage on the plateform after 2015. The current usage metrics is available 48-96 hours after online publication and is updated daily on week days.
Initial download of the metrics may take a while.