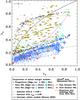
Fig. 2

The λe – ϵe
diagram considering 200 random projections in each remnant and in the original S0
galaxies, compared with the distributions of fast- and slow-rotator S0s from the
ATLAS3D
sample (yellow and red galaxy-like symbols respectively, see E11). Left
panel: for all models, independently of their spin-orbit coupling. The
projections of the original S0 galaxies are plotted with black points, blue points
correspond to the remnants of the experiments with an original S0b primary galaxy,
and green ones to those with an original primary S0c. Stars indicate the location
of each remnant in an edge-on view (blue and green filled stars for the original
S0b and S0c galaxies; blue and green empty stars for the remnants of the models
with an original S0b and S0c galaxy, respectively). The stars marked with a cross
correspond to retrograde models. Right panel: the same as in the
left panel, but distinguishing between the projections of
prograde and retrograde models. The prograde remnants are plotted with points
(light blue for those with an original S0b galaxy; light green for the one with an
original S0c). The retrogrades are symbolized with crosses (dark blue for original
S0b primary galaxies; olive green for the one with an original primary S0c). Black
solid line: theoretical relation of isotropic oblate systems viewed edge-on from
Binney (2005). Green dashed line:
empirical limit isolating fast from slow rotators defined by E11 (equivalent to
0.31 ).
Black dotted line: location of galaxies with an intrinsic ellipticity
ϵ =
0.82 when going from a face-on to an edge-on view, to show the
effects of inclination. Magenta solid line: edge-on view of ellipsoidal galaxies
integrated within r =
Reff,glx for an
anisotropy β =
0.65ϵ (for more details, see E11). The error
bars on the left upper corner of each frame represent the typical errors in both
axes (mean values of all projections). (This figure is available in color in
electronic form.)
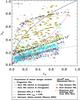
).
Black dotted line: location of galaxies with an intrinsic ellipticity
ϵ =
0.82 when going from a face-on to an edge-on view, to show the
effects of inclination. Magenta solid line: edge-on view of ellipsoidal galaxies
integrated within r =
Reff,glx for an
anisotropy β =
0.65ϵ (for more details, see E11). The error
bars on the left upper corner of each frame represent the typical errors in both
axes (mean values of all projections). (This figure is available in color in
electronic form.)
Current usage metrics show cumulative count of Article Views (full-text article views including HTML views, PDF and ePub downloads, according to the available data) and Abstracts Views on Vision4Press platform.
Data correspond to usage on the plateform after 2015. The current usage metrics is available 48-96 hours after online publication and is updated daily on week days.
Initial download of the metrics may take a while.