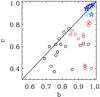
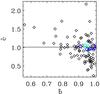
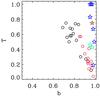
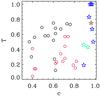
Fig. 11
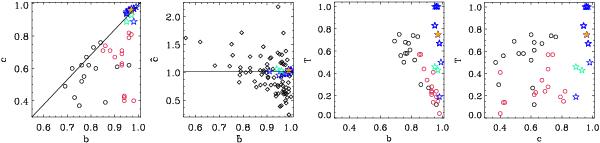
Shape diagrams of our remnant bulges, computed considering all stars at r ≤ reff,bulge in the remnants. The blue and green stars in all panels represent the models with a primary S0b and S0c galaxy, respectively. The location of the original primary bulges is shown with orange stars. First panel: minor versus major axial ratios of our remnant bulges computed according to the Cox et al. (2006a) criterion (A>B>C), compared with their simulated remnants of equal-mass major mergers of galaxies with pure exponential stellar discs (black circles) and containing 40% of gas (red circles). The line represents the location of a prolate spheroid with T = 1. Second panel: axial ratios of our remnant bulges computed according to the Méndez-Abreu et al. (2010) criterion (A>B lying in the equatorial plane, and C perpendicular to it), compared with the observed distribution of their sample of 115 S0–Sb bulges (black diamonds). The straight line marks ĉ = 1. Third and fourth panels: triaxiality as a function of the major and minor axial ratios of our remnant bulges, compared with the major merger experiments of Cox et al. (2006a). The legend is the same as in the left panel. (This figure is available in color in electronic form.)
Current usage metrics show cumulative count of Article Views (full-text article views including HTML views, PDF and ePub downloads, according to the available data) and Abstracts Views on Vision4Press platform.
Data correspond to usage on the plateform after 2015. The current usage metrics is available 48-96 hours after online publication and is updated daily on week days.
Initial download of the metrics may take a while.