Fig. 5
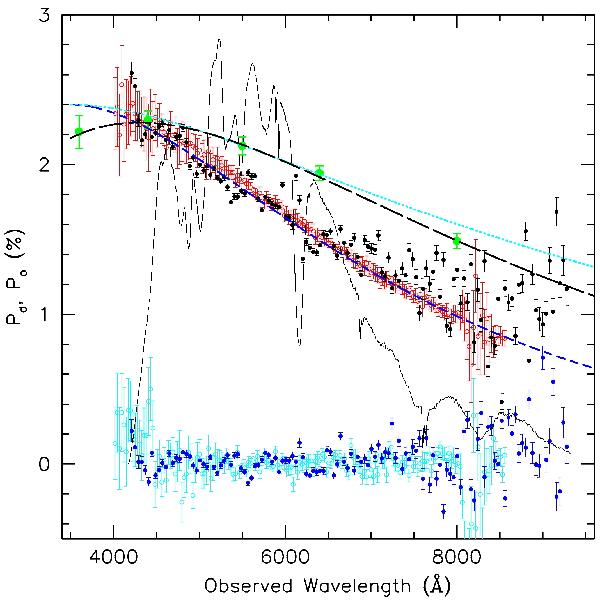
Spectropolarimetry of SN 2008fp along the dominant (upper) and orthogonal (lower) axes (filled symbols) on day +6. The underlying solid curve traces the unbinned observed spectrum of SN 2008fp on the same epoch. For comparison the scaled data of SN 2006X are presented as well (empty symbols; Patat et al. 2009). The short-dashed line is a best fit to the SN 2006X data using a Serkowski law (λmax = 3500 Å, K = 1.30), while the dotted line is the same but with K given by the Whittet et al. (1992) relation (K = 0.59). The large, filled dots indicate the scaled broad-band polarimetry measurements of SN 1986G (Hough et al. 1987). The long-dashed curve traces a best-fit Serkowski law (λmax = 4300 Å, K = 1.10).
Current usage metrics show cumulative count of Article Views (full-text article views including HTML views, PDF and ePub downloads, according to the available data) and Abstracts Views on Vision4Press platform.
Data correspond to usage on the plateform after 2015. The current usage metrics is available 48-96 hours after online publication and is updated daily on week days.
Initial download of the metrics may take a while.