Fig. 1
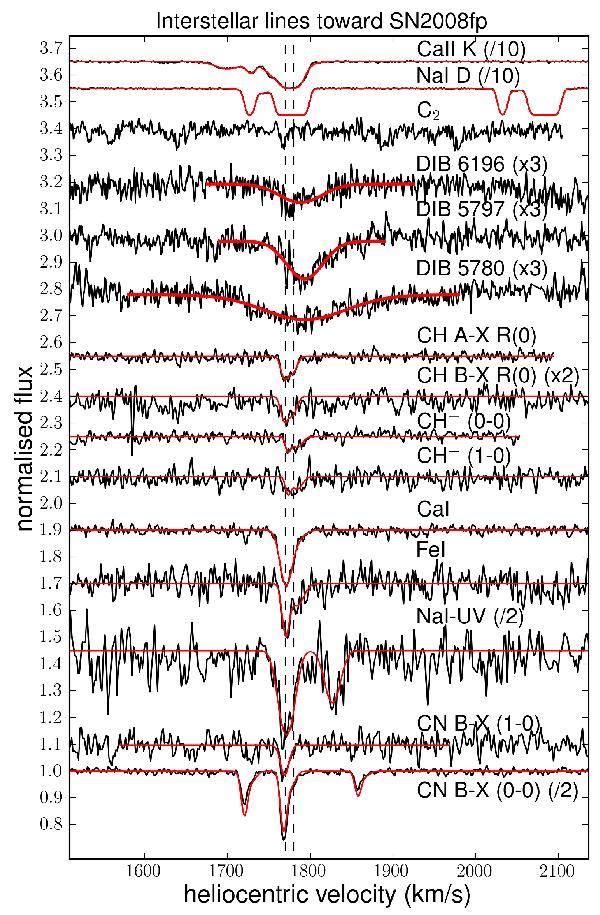
Interstellar absorption lines towards SN 2008fp. Synthetic line profiles obtained with VPFIT are shown as solid red curves overplotted on the observed spectra. Details of the models are given in Table 3. The vertical dashed line are drawn at 1770 and 1778 km s-1, the average peak radial velocity for the strongest interstellar components. The 5797 DIB and CH+ appear slightly red-shifted with respect to the average radial velocity. The shift for 5797 DIB corresponds to roughly 0.4 Å or 20 km s-1. Two velocity components separated by ~8 km s-1 are discerned in the absorption profiles of CN, CH, and CH+.
Current usage metrics show cumulative count of Article Views (full-text article views including HTML views, PDF and ePub downloads, according to the available data) and Abstracts Views on Vision4Press platform.
Data correspond to usage on the plateform after 2015. The current usage metrics is available 48-96 hours after online publication and is updated daily on week days.
Initial download of the metrics may take a while.