Fig. B.1
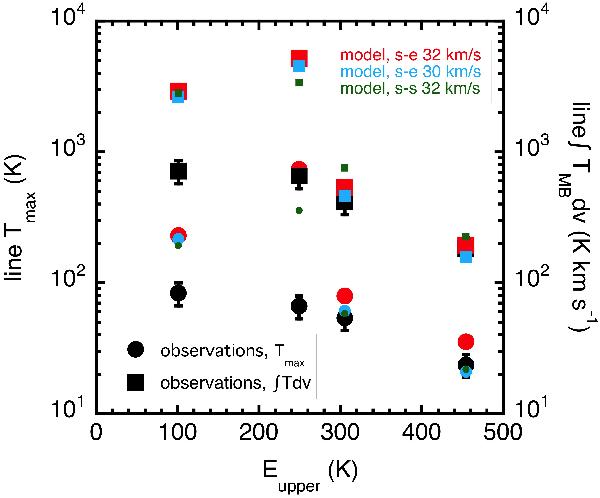
Observed and modelled maximum brightness temperatures (circles), and integrated intensities (squares) for the blue-shifted emission. Data points (in black) are corrected for an emission region of 3 arcsec2 and for 60% of the emission due to OF1. Errorbars are ±20% of the observed value. Three models are shown: the model of Paper II with level populations in statistical equilibrium (“s-e” in red) with νs = 32 km s-1, one with a slower shock velocity (νs = 30 km s-1, blue), and a model in stationary-state (“s-s” in green).
Current usage metrics show cumulative count of Article Views (full-text article views including HTML views, PDF and ePub downloads, according to the available data) and Abstracts Views on Vision4Press platform.
Data correspond to usage on the plateform after 2015. The current usage metrics is available 48-96 hours after online publication and is updated daily on week days.
Initial download of the metrics may take a while.