Fig. A.1
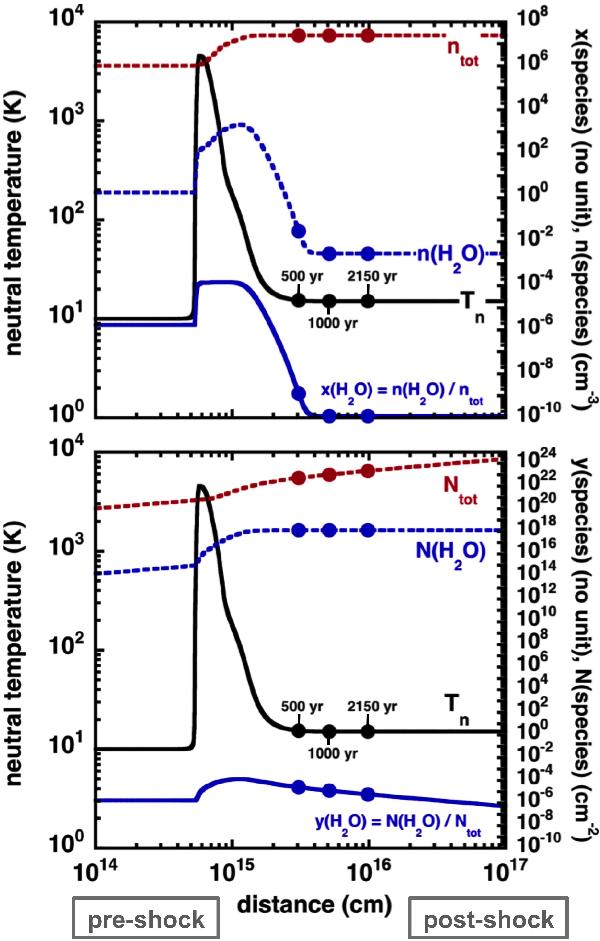
Upper panel: neutral temperature (black curve), total density (red dashed curve), water density (blue dashed curve), and fractional density (blue continuous curve). The so-called fractional density is the water density over the total density, locally defined at each point of the shock. Lower panel: neutral temperature (black curve), total column density (red dashed curve), water column density (blue dashed curve), and fractional column density (blue continuous curve). The so-called fractional column density is the water column density over the total column density. The column density (in cm-2) is the integral of the local density (in cm-3) along the shock width (in cm). In both panels, the three points labelled on each curve correspond to the distance parameter of 3.1 × 10¹⁵, 5.15 × 10¹⁵, 1016 cm, or to time parameters values of 500, 1000, and 2150 yr.
Current usage metrics show cumulative count of Article Views (full-text article views including HTML views, PDF and ePub downloads, according to the available data) and Abstracts Views on Vision4Press platform.
Data correspond to usage on the plateform after 2015. The current usage metrics is available 48-96 hours after online publication and is updated daily on week days.
Initial download of the metrics may take a while.