Fig. 1
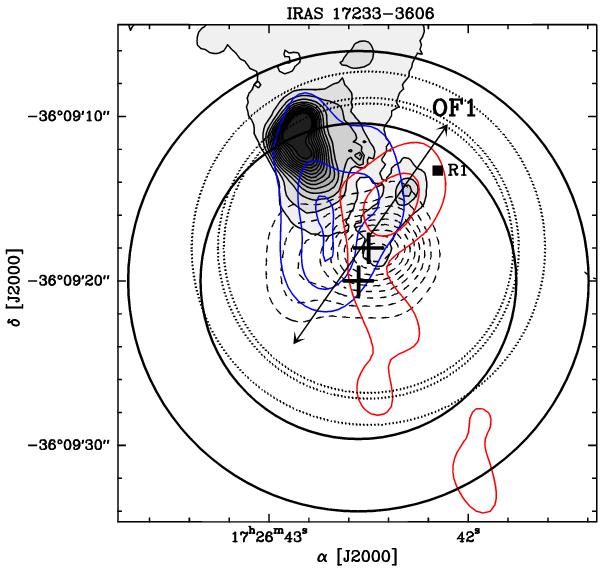
Grey scale and solid black contours represent the H2 emission at 2.12 μm; dashed contours are the 1.4 mm continuum emission. Red and blue contours are the SMA integrated emission of the SiO(5–4) line (νbl = [−30, −20] km s-1 and νrd = [+10, +39] km s-1). The crosses mark the Herschel pointings; the solid and dotted circles are the Herschel beams (Sect. 2). The square marks the peak of the EHV CO(2–1) red-shifted emission (R1). The arrow marks the OF1 outflow.
Current usage metrics show cumulative count of Article Views (full-text article views including HTML views, PDF and ePub downloads, according to the available data) and Abstracts Views on Vision4Press platform.
Data correspond to usage on the plateform after 2015. The current usage metrics is available 48-96 hours after online publication and is updated daily on week days.
Initial download of the metrics may take a while.