Fig. 1
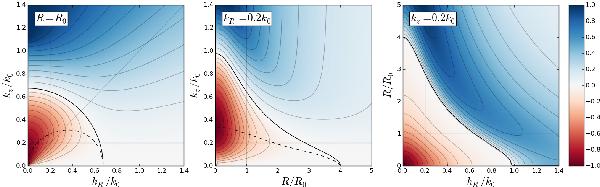
Projection of the distribution of the frequency  in the planes R = R0, kR = 0.2k0, and kz = 0.2k0 for an idealized filament inspired by TMC-1, with R0 = 0.043 pc and k0 = 74 pc-1. The color scale is normalized to its maximum for positive values of and to its minimum for negative values. The contours are equally spaced. Negative values of correspond to an unstable filament, whereas the filament should be stable in the region where is positive. The solid black curve separates the stable and unstable regimes, and corresponds to k = kcrit. This threshold corresponds to a length scale λcrit = 2π/kcrit = 0.13 pc at R = R0. The dashed line corresponds to the minimum value of , i.e., to the most unstable mode, and is obtained from equation 25 for the first panel. It intersects the line kz = kR at kR,threshold = 0.31k0, which corresponds to λthreshold = 0.28 pc.
Current usage metrics show cumulative count of Article Views (full-text article views including HTML views, PDF and ePub downloads, according to the available data) and Abstracts Views on Vision4Press platform.
Data correspond to usage on the plateform after 2015. The current usage metrics is available 48-96 hours after online publication and is updated daily on week days.
Initial download of the metrics may take a while.