Free Access
Fig. 4
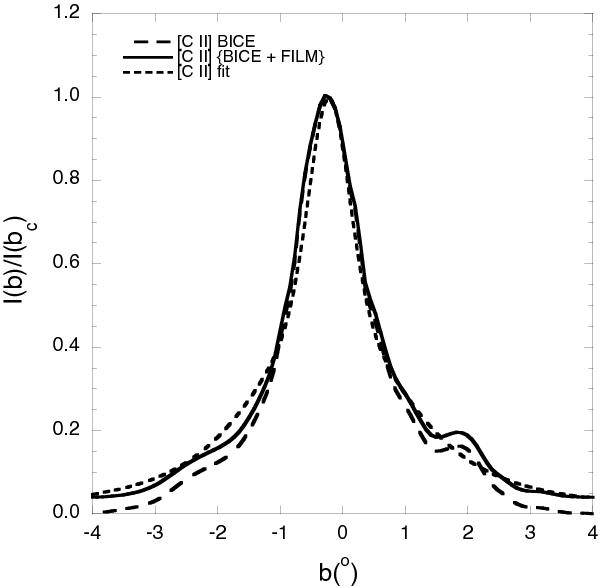
Model fit (dotted line) of the normalized intensity using the GOT C+ observations at b = 0° compared to the normalized intensity from the modified BICE + FILM profile (solid line) versus latitude b. The unmodified BICE profiles are shown for comparison (dashed line).
Current usage metrics show cumulative count of Article Views (full-text article views including HTML views, PDF and ePub downloads, according to the available data) and Abstracts Views on Vision4Press platform.
Data correspond to usage on the plateform after 2015. The current usage metrics is available 48-96 hours after online publication and is updated daily on week days.
Initial download of the metrics may take a while.