Fig. 13
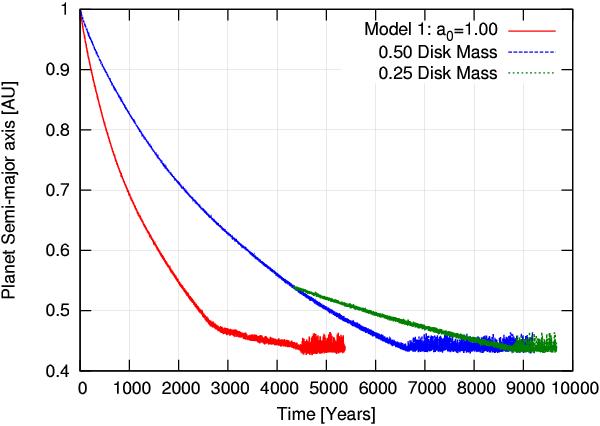
Evolution of the semi-major axis of a planet embedded in an isothermal disk for different values of the disk mass. The graph in red corresponds to the simulation of the standard disk model with the planet initially starting at a0 = 1.0 AU. The graph in blue shows a similar simulation but with half the disk mass. The graph in green corresponds to a simulation with a quarter of the initial disk mass that is continued from the model in blue at t = 4300.
Current usage metrics show cumulative count of Article Views (full-text article views including HTML views, PDF and ePub downloads, according to the available data) and Abstracts Views on Vision4Press platform.
Data correspond to usage on the plateform after 2015. The current usage metrics is available 48-96 hours after online publication and is updated daily on week days.
Initial download of the metrics may take a while.