Free Access
Fig. 4
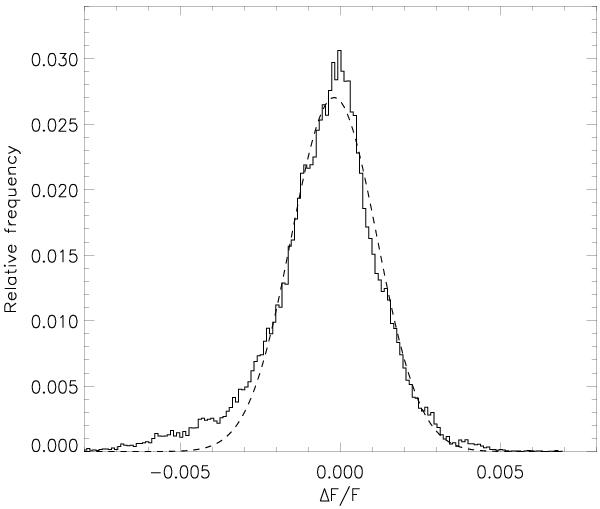
Distribution of the residuals of the composite best fit to the entire time series of Kepler-30 obtained with the two-spot model with DR for M = 51. The dashed line is a Gaussian best fit to the distribution.
Current usage metrics show cumulative count of Article Views (full-text article views including HTML views, PDF and ePub downloads, according to the available data) and Abstracts Views on Vision4Press platform.
Data correspond to usage on the plateform after 2015. The current usage metrics is available 48-96 hours after online publication and is updated daily on week days.
Initial download of the metrics may take a while.