Fig. 13
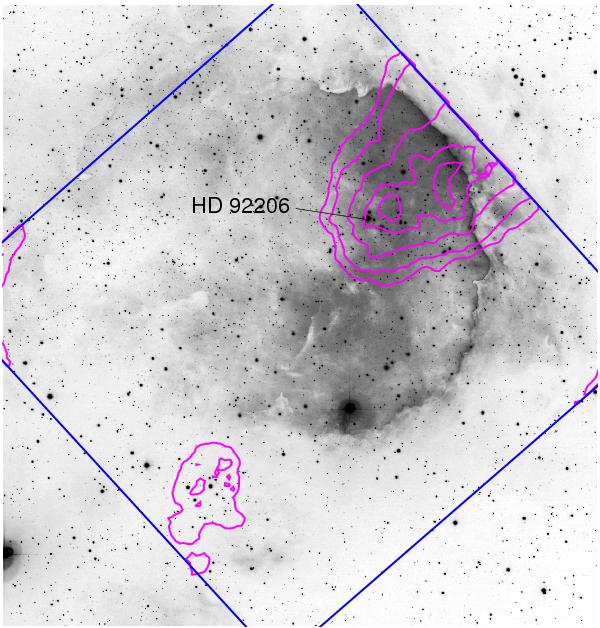
Negative representation of the WFI R-band image (see www.eso.org/public/images/eso1207a/; image credit: ESO) with superposed contours of the smoothed apparent surface brightness of the diffuse X-ray emission in the 0.5 − 7 keV band (point-sources have been excised). The contour levels are drawn at levels of 1.9,2.1,2.6,3.4, and 4.0 × 10⁻⁹ photons s-1 cm-2 arcsec-2. The blue lines mark the borders of the 17′ × 17′Chandra/ACIS-I field-of-view. The position of the O-star multiple system HD 92 206 is marked.
Current usage metrics show cumulative count of Article Views (full-text article views including HTML views, PDF and ePub downloads, according to the available data) and Abstracts Views on Vision4Press platform.
Data correspond to usage on the plateform after 2015. The current usage metrics is available 48-96 hours after online publication and is updated daily on week days.
Initial download of the metrics may take a while.