Fig. 12
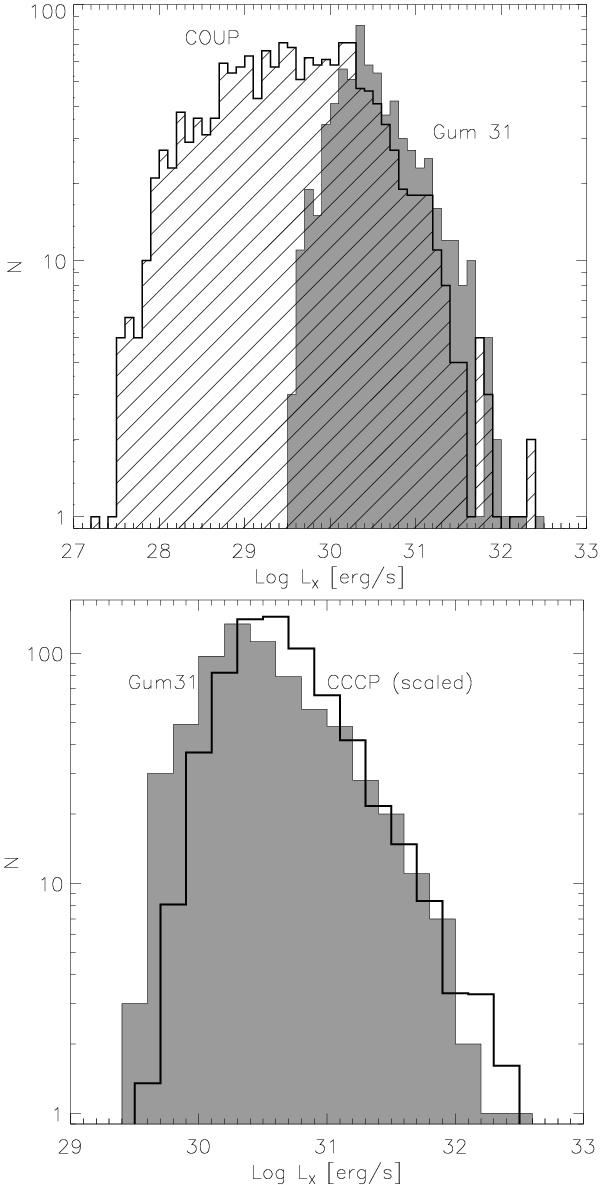
Comparison of the X-ray luminosity function of the Chandra sources in our Gum 31 observation (grey-shaded histogram) to (top) the XLF of the Orion nebula cluster (dashed histogram) (from the COUP data; Getman et al. 2005), and to (bottom) the XLF for the CCCP sources as shown in Fig. 3 of Feigelson et al. (2011), scaled to account for the different sample sizes.
Current usage metrics show cumulative count of Article Views (full-text article views including HTML views, PDF and ePub downloads, according to the available data) and Abstracts Views on Vision4Press platform.
Data correspond to usage on the plateform after 2015. The current usage metrics is available 48-96 hours after online publication and is updated daily on week days.
Initial download of the metrics may take a while.