Fig. 11
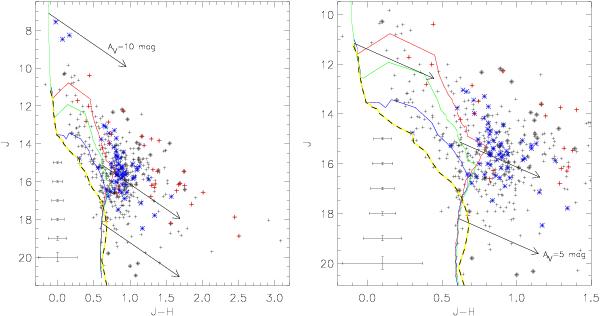
Left: NIR color−magnitude diagram of the X-ray selected sources (crosses). The X-ray sources in the NGC 3324 cluster region are marked by blue asterisks, whereas the sources in the G286.38–0.26 cluster region are marked by red crosses. Sources with NIR excesses are additionally marked by filled grey diamonds. The solid lines show isochrones for ages of 1 Myr (red), 3 Myr (green), and 10 Myr (blue) composed from the models of Baraffe et al. (1998) for the mass range 0.02 to 0.5 M⊙, Siess et al. (2000) for the mass range 0.5 to 7 M⊙, and Lejeune & Schaerer (2001) (model iso-c020-0650) for the mass range 7 to 70 M⊙; the dashed line shows the ZAMS from Siess et al. (2000). The arrows indicate reddening vectors for AV = 10 mag starting at the location of 3 Myr old stars with masses of 35 M⊙, 1 M⊙, and 0.1 M⊙. The row of error-crosses in the lower left part of the plot shows the typical magnitude-dependent photometric uncertainties. Right: zoom into the central region of the CMD. The arrows indicate reddening vectors for AV = 5 mag starting at the location of 3 Myr old stars with masses of 7 M⊙, 1 M⊙, and 0.1 M⊙.
Current usage metrics show cumulative count of Article Views (full-text article views including HTML views, PDF and ePub downloads, according to the available data) and Abstracts Views on Vision4Press platform.
Data correspond to usage on the plateform after 2015. The current usage metrics is available 48-96 hours after online publication and is updated daily on week days.
Initial download of the metrics may take a while.