Fig. 10
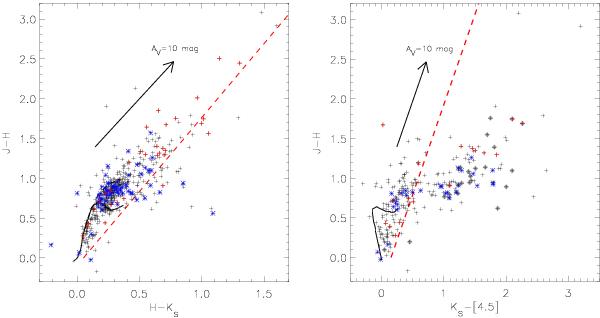
Left: NIR J − H versus H − K color−color diagram of all X-ray selected sources (crosses). The X-ray sources in the NGC 3324 cluster region are marked by blue asterisks, whereas the sources in the G286.38–0.26 cluster region are marked by red crosses. The solid line shows the main sequence, the arrow shows a AV = 10 mag reddening vector with slope 1.85, and the red dashed line marks the separation between the photospheric reddening band and the infrared excess region. Objects are classified as NIR excess sources if they lie at least 0.05 mag to the right of the reddening band and above J − H = 0. Right: near- to mid-infrared J − H versus K − [4.5] color−color diagram of all X-ray selected sources. The symbols have the same meaning as in the left plot. Sources with NIR excesses are additionally marked by filled grey diamonds.
Current usage metrics show cumulative count of Article Views (full-text article views including HTML views, PDF and ePub downloads, according to the available data) and Abstracts Views on Vision4Press platform.
Data correspond to usage on the plateform after 2015. The current usage metrics is available 48-96 hours after online publication and is updated daily on week days.
Initial download of the metrics may take a while.