Fig. 4
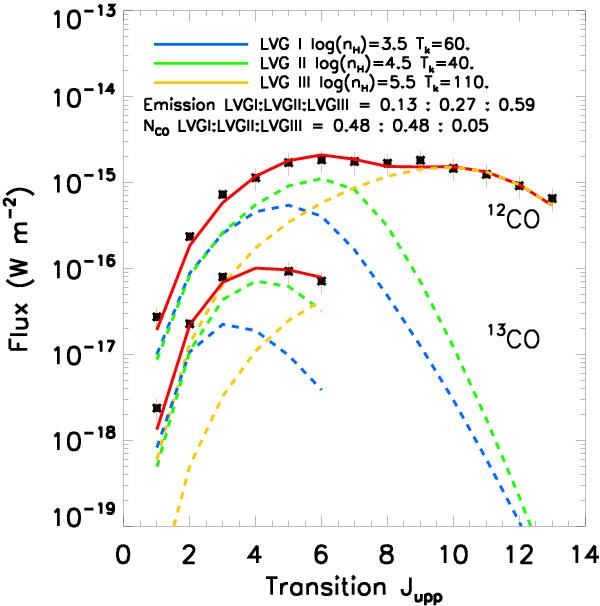
12CO and 13CO excitation ladders of NGC 253 with the flux of each transition plotted as black asterisks with red error bars. In dotted blue, green, and yellow lines we plot the LVG I, II, and III ISM phases with their filling factors. The composite model is plotted with a solid red line. The model density, temperature, and column density are shown in the legend along with the relative contribution of each phase in terms of emission and column density.
Current usage metrics show cumulative count of Article Views (full-text article views including HTML views, PDF and ePub downloads, according to the available data) and Abstracts Views on Vision4Press platform.
Data correspond to usage on the plateform after 2015. The current usage metrics is available 48-96 hours after online publication and is updated daily on week days.
Initial download of the metrics may take a while.