Fig. 3
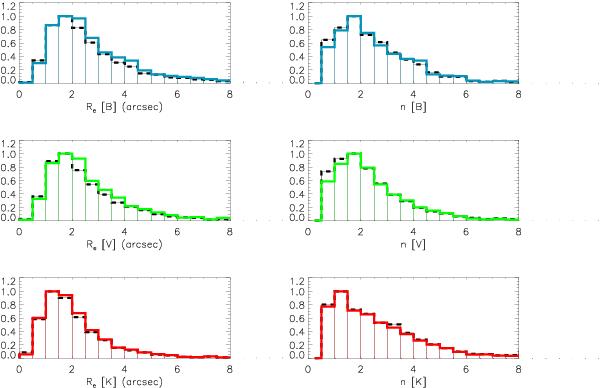
Distribution of Sersic index (right panels) and effective radius (left panels) retrieved by GASPHOT for the spectroscopic members of our WINGS clusters in the three bands covered by our photometry: from top to bottom data are from the B images, the V images, and the K images. Dashed black lines refer to the entire WINGS sample, while the colored continuous lines are for the spectroscopic members observed in the three bands.
Current usage metrics show cumulative count of Article Views (full-text article views including HTML views, PDF and ePub downloads, according to the available data) and Abstracts Views on Vision4Press platform.
Data correspond to usage on the plateform after 2015. The current usage metrics is available 48-96 hours after online publication and is updated daily on week days.
Initial download of the metrics may take a while.