Fig. 7
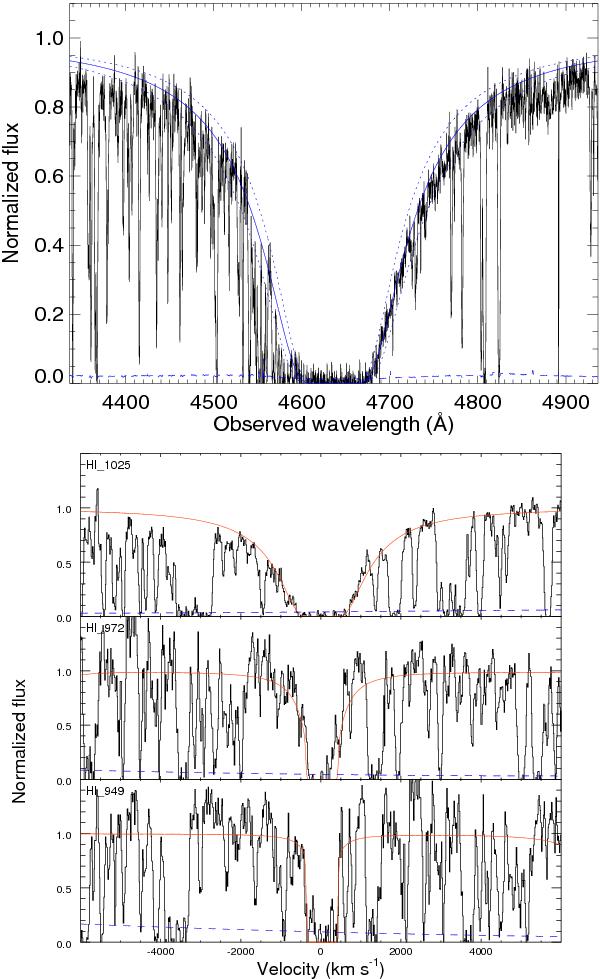
Top panel: Lyα absorption feature at the GRB 120327A redshift. The solid, blue line represents the best-fit model to the absorption profile; the dotted, blue lines enclose the 1σ uncertainty. Bottom panel: Lyβ, Lyγ and Lyδ features (from top to bottom) and the corresponding fit result (solid, red lines). Dashed blue lines displays the error spectrum.
Current usage metrics show cumulative count of Article Views (full-text article views including HTML views, PDF and ePub downloads, according to the available data) and Abstracts Views on Vision4Press platform.
Data correspond to usage on the plateform after 2015. The current usage metrics is available 48-96 hours after online publication and is updated daily on week days.
Initial download of the metrics may take a while.