Fig. 3
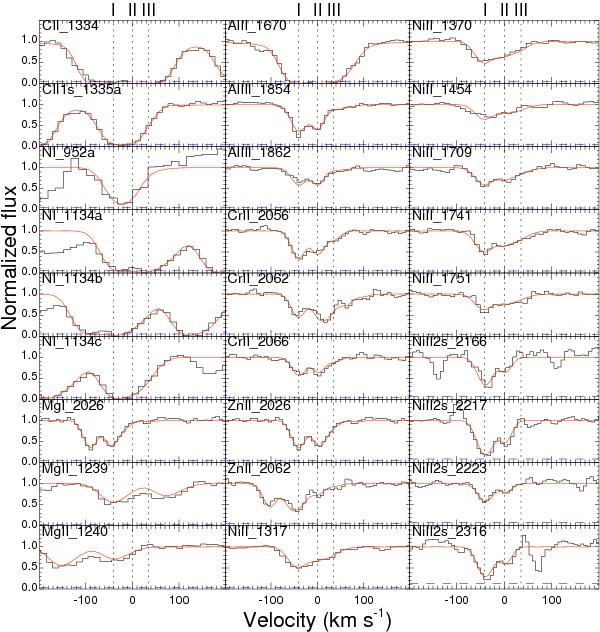
GRB 120327A absorption features. Solid, red lines represent the best-fit model to the three Voigt components. Vertical dashed lines identify the component velocities. Blue, dashed lines display the error spectrum. The zero point has been arbitrarily placed at the redshift of the second component (z = 2.8145). The absorption on the left of the Mg i λ2026 line is due to Zn iiλ2026.
Current usage metrics show cumulative count of Article Views (full-text article views including HTML views, PDF and ePub downloads, according to the available data) and Abstracts Views on Vision4Press platform.
Data correspond to usage on the plateform after 2015. The current usage metrics is available 48-96 hours after online publication and is updated daily on week days.
Initial download of the metrics may take a while.