Fig. 13
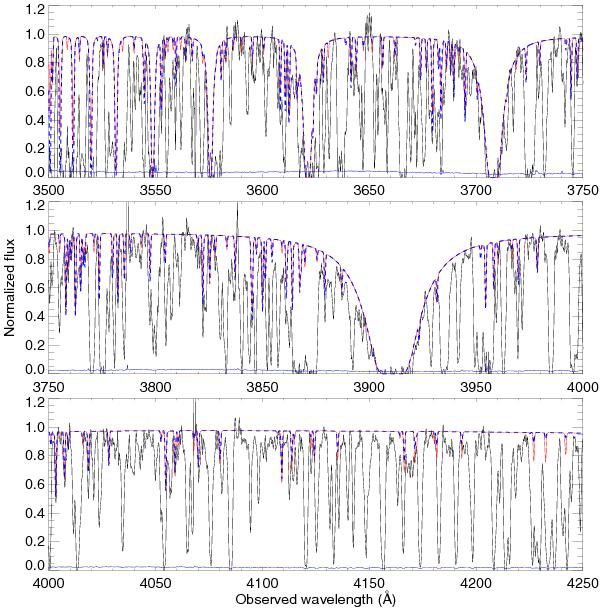
Single component fit for the H2 absorption lines. The two models with b = 1 and b = 10 km s-1 are shown in dashed blue and solid red, respectively. These models are barely distinguishable by eye, a deep zoom is necessary to catch the different profiles. The X-shooter spectrum is overimposed in black. The bottom, blue solid line displays the error spectrum.
Current usage metrics show cumulative count of Article Views (full-text article views including HTML views, PDF and ePub downloads, according to the available data) and Abstracts Views on Vision4Press platform.
Data correspond to usage on the plateform after 2015. The current usage metrics is available 48-96 hours after online publication and is updated daily on week days.
Initial download of the metrics may take a while.