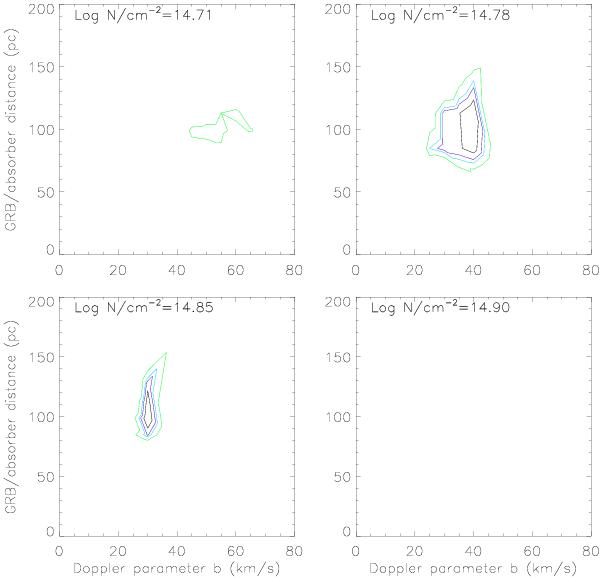
Fig. 11

Contour plots describing the data/model agreement in the computation of the distance between the GRB and component II. The four plots display the contours in the plane of Doppler parameter and GRB/absorber distance for different initial Fe ii column densities. Black, violet, cyan and green contours enclose the 68%, 90%, 95% and 99% confidence regions, respectively. The bottom right panel is empty as at the corresponding density no combination of Doppler parameter and distance falls inside the 99% confidence surface.
Current usage metrics show cumulative count of Article Views (full-text article views including HTML views, PDF and ePub downloads, according to the available data) and Abstracts Views on Vision4Press platform.
Data correspond to usage on the plateform after 2015. The current usage metrics is available 48-96 hours after online publication and is updated daily on week days.
Initial download of the metrics may take a while.


