Fig. 10
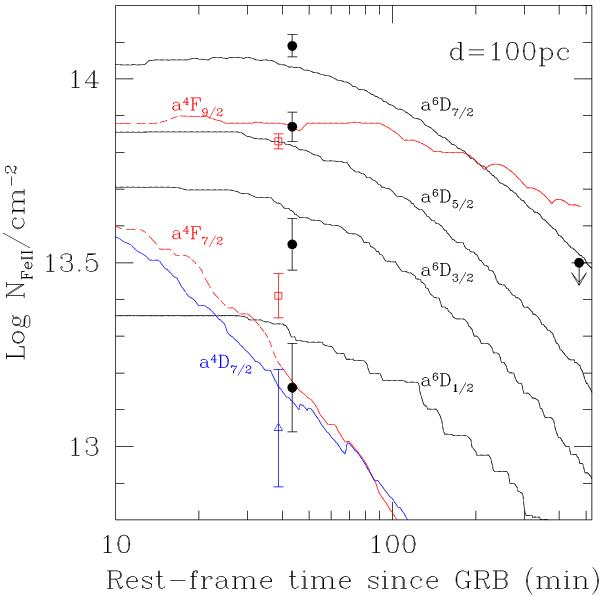
Same as in Fig. 8, but for component II and an absorber placed at 100 pc. In addition, the blue, open triangle plots the second excited level of the Fe ii, while the blue solid line indicates the corresponding expectation from the time-dependent photo-excitation code. For clarity reasons, black points and curves have been slightly offset to the right.
Current usage metrics show cumulative count of Article Views (full-text article views including HTML views, PDF and ePub downloads, according to the available data) and Abstracts Views on Vision4Press platform.
Data correspond to usage on the plateform after 2015. The current usage metrics is available 48-96 hours after online publication and is updated daily on week days.
Initial download of the metrics may take a while.