Fig. 8
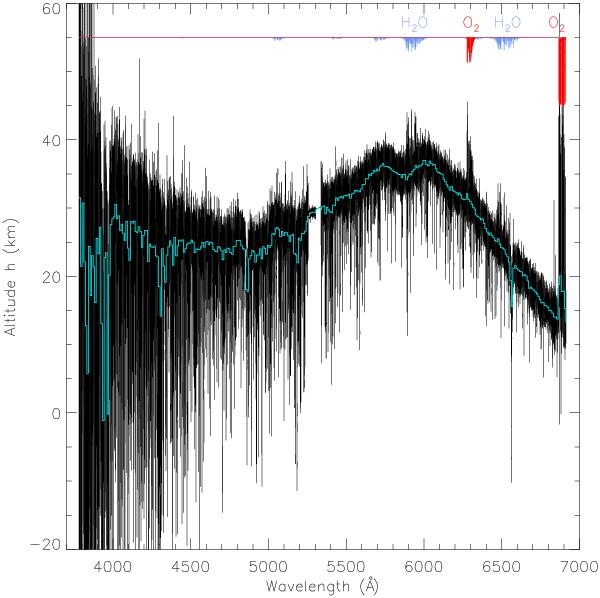
Altitude profile with HARPS as obtained from Eq. (1) (method 1). A 10 Å bin is superimposed in light-blue over the full-resolution profile. The profile shows the large bump due to ozone Chappuis band around 6000 Å, the oxygen γ- and B-band at 6300 at 6900 Å respectively, and also the water-vapour band around 6500 Å. The expected increased of h(λ) in the blue due to Rayleigh is visible as a negative slope between 4000 and 5000 Å. Oxygen and water-vapour absorption spectra at arbitrary scale are shown.
Current usage metrics show cumulative count of Article Views (full-text article views including HTML views, PDF and ePub downloads, according to the available data) and Abstracts Views on Vision4Press platform.
Data correspond to usage on the plateform after 2015. The current usage metrics is available 48-96 hours after online publication and is updated daily on week days.
Initial download of the metrics may take a while.