Fig. 7
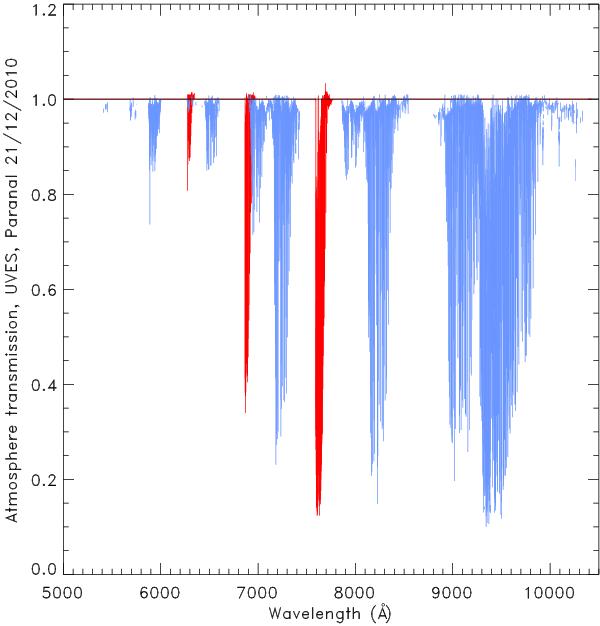
Paranal atmosphere transmission function T(λ) for AM = 1 as evaluated from full-Moon spectra taken with UVES before the eclipse, following the reduction process described in Sect. 6.2. The UVES reduction pipeline automatically removes from all individual spectra tabulated values for the Rayleigh, aerosol and ozone signatures at the corresponding airmass of the observation. These signatures therefore do not appear here as for HARPS (Fig. 4). A weak residual curvature of the continuum (≈5% maximum at 7800 Å, with no resemblance to a residual signature of ozone or Rayleigh) was fitted with a second-order function. The spectrum shown here is normalized to this fit to have a flat continuum at 1 (horizontal line). The O2γ, A, and B bands are clearly seen (in red), the other bands are due to H2O (in blue).
Current usage metrics show cumulative count of Article Views (full-text article views including HTML views, PDF and ePub downloads, according to the available data) and Abstracts Views on Vision4Press platform.
Data correspond to usage on the plateform after 2015. The current usage metrics is available 48-96 hours after online publication and is updated daily on week days.
Initial download of the metrics may take a while.