Fig. 6
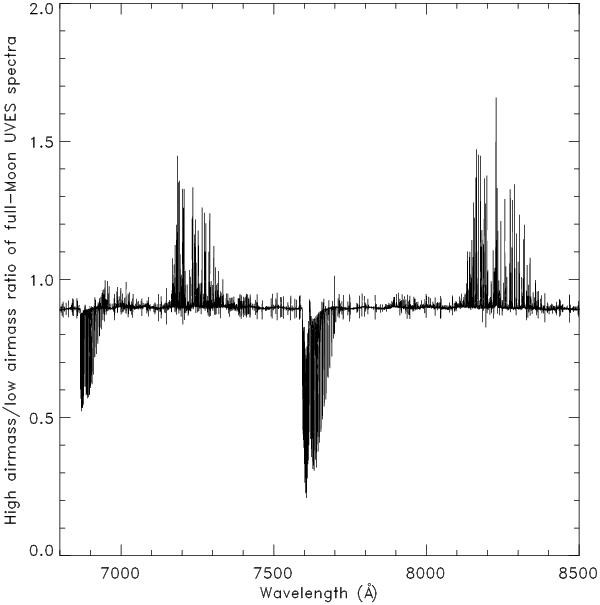
Part of the spectrum showing the ratio of a high airmass over a low airmass UVES full-Moon spectra. The oxygen B and A bands at 6900 and 7600 Å respectively, are in absorption as expected, but the water vapour bands at 7200 and 8200 Å appear in emission, showing that the amount of water vapour along the line of sight was higher when the airmass was lower, indicating that the amount of water vapour above Paranal increased during the first part of the night, before the eclipse. To calculate this ratio, the spectra are aligned by cross-correlation to match the radial velocity of the telluric lines, so the solar lines do not properly cancel out in the ratio, and appear with a wing in emission and the other in absorption.
Current usage metrics show cumulative count of Article Views (full-text article views including HTML views, PDF and ePub downloads, according to the available data) and Abstracts Views on Vision4Press platform.
Data correspond to usage on the plateform after 2015. The current usage metrics is available 48-96 hours after online publication and is updated daily on week days.
Initial download of the metrics may take a while.