Fig. 4
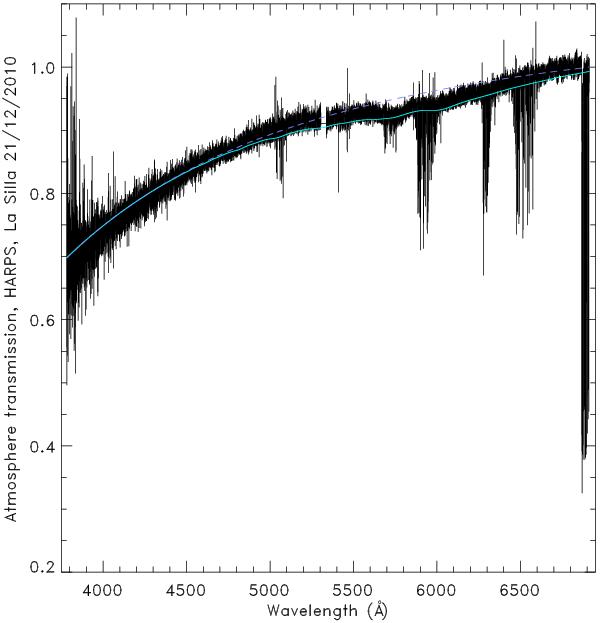
La Silla atmosphere transmission function T(λ) for AM = 1 as evaluated from full-Moon spectra taken with HARPS just before the eclipse (Table 2). The spectrum is normalized at 6866 Å. To verify this experimental T(λ) spectrum, a transmission fit based on the model of Hayes & Latham (1975) for the Rayleigh and aerosol components normalized at 6866 Å is displayed (blue dashed line). We also add an ozone transmission spectrum to the model (light-blue solid line) that correctly fits the observed wide Chappuis band. The best least-squares fit for Rayleigh and ozone over La Silla that night is obtained for an airmass of AM = 0.77 for ozone and Rayleigh, and an optical depth of 0.181 at 5320 Å for the aerosols, between 4000 and 6866 Å. The fit for ozone is made only where O2 and H2O absorption bands are absent. The O2γ and B absorption bands are clearly seen, around 6300 and 6900 Å respectively, the other deep bands are due to H2O. The small gap in HARPS data is visible between 5300 and 5340 Å (Table 1).
Current usage metrics show cumulative count of Article Views (full-text article views including HTML views, PDF and ePub downloads, according to the available data) and Abstracts Views on Vision4Press platform.
Data correspond to usage on the plateform after 2015. The current usage metrics is available 48-96 hours after online publication and is updated daily on week days.
Initial download of the metrics may take a while.