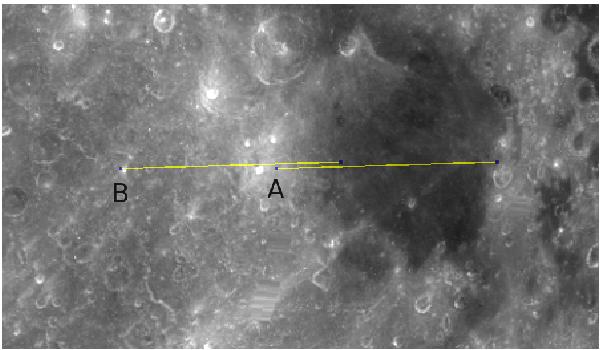
Fig. 3

Example of a path of the HARPS fibers across the reconstructed Moon image, during the 300 s exposure in the penumbra. The darkening from the penumbra and umbra are not superimposed on the image here, since we are only interested in recovering the moon reflectivity. The A and B fibers remained at 232 and 125 arcsec from the umbra edge, while the fibers path across the Moon was ≈164 arcsec long (length of the yellow lines). The mean reflectivity is measured along the path, taking into account a 10 arcsec pointing error in both RA and Dec directions. The terrain reflectivity fluctuates by σ = 21% along the path for Fiber A and σ = 15% for Fiber B in this highly contrasted lunar region. The error on the mean reflectivity due to pointing uncertainty is estimated to be about σ = 4%. The figure shows that while Fiber A went through the dark region of Mare Nectaris, Fiber B remained on a region measured 39% brighter between Catharina and Cyrillus craters, pointing out the relevance of correcting the flux for lunar local reflectivity.
Current usage metrics show cumulative count of Article Views (full-text article views including HTML views, PDF and ePub downloads, according to the available data) and Abstracts Views on Vision4Press platform.
Data correspond to usage on the plateform after 2015. The current usage metrics is available 48-96 hours after online publication and is updated daily on week days.
Initial download of the metrics may take a while.


