Fig. 27
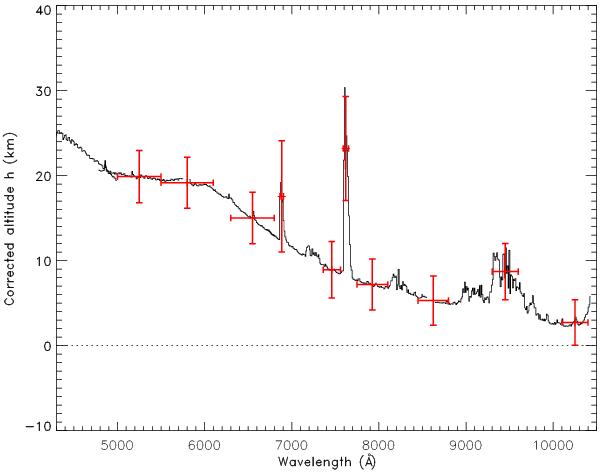
Simulated observations with the E-ELT of an Earth twin at 10 pc transiting a G2V star, at low spectral resolution and assuming no atmospheric perturbations (Table 7). The simulated observations are shown in red. The horizontal bars represent the filter bandwidth and the vertical error bars are the ±1σ estimated error from the model. The solid line is the 10 Å bin UVES profile (method 3).
Current usage metrics show cumulative count of Article Views (full-text article views including HTML views, PDF and ePub downloads, according to the available data) and Abstracts Views on Vision4Press platform.
Data correspond to usage on the plateform after 2015. The current usage metrics is available 48-96 hours after online publication and is updated daily on week days.
Initial download of the metrics may take a while.