Fig. 25
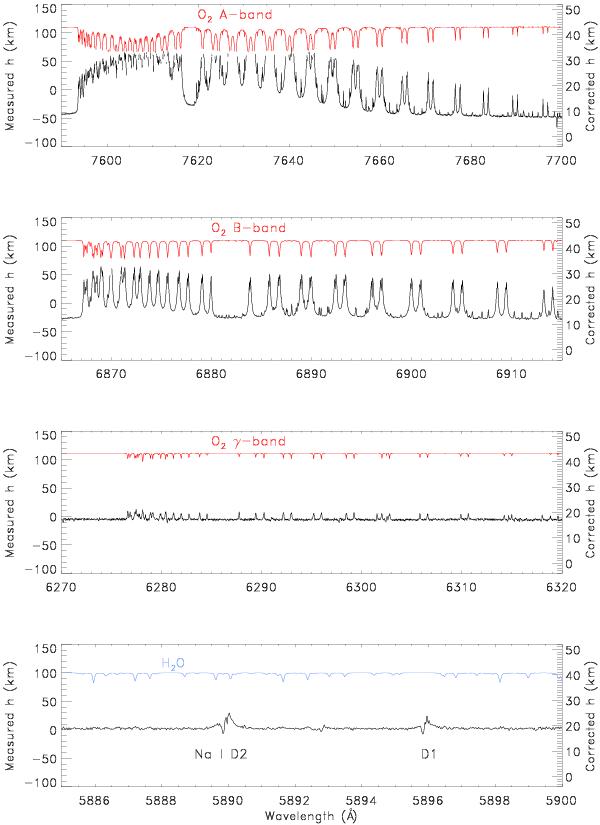
Zooms on the UVES altitude profile from method 3 shown in Fig. 24. The UVES oxygen spectrum at arbitrary scale is shown. The three oxygen bands are clearly detected. Note that we were unable to calculate the core of the oxygen line for the A-band because the signal in the line core is too weak. The sodium layer is not detected. Water-vapour absorption is too weak in the Na I region to appear above 19 km.
Current usage metrics show cumulative count of Article Views (full-text article views including HTML views, PDF and ePub downloads, according to the available data) and Abstracts Views on Vision4Press platform.
Data correspond to usage on the plateform after 2015. The current usage metrics is available 48-96 hours after online publication and is updated daily on week days.
Initial download of the metrics may take a while.