Fig. 21
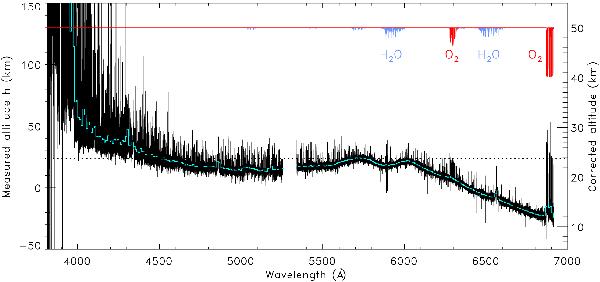
Altitude profile obtained with HARPS and method 3. The left vertical axis is the measured altitude, set to 23.8 km at at [4520–4540] Å. The right vertical axis is the corrected altitude, if one considers the lowest region of h close to altitude 12 km as in Fig. 12 and again h = 23.8 km at [4520–4540] Å. The horizontal dotted line represents the altitude 23.8 km.The light-blue line is a 10 Å bin superimposed on the full-resolution profile. Oxygen and water-vapour absorption spectra at arbitrary scale are shown.
Current usage metrics show cumulative count of Article Views (full-text article views including HTML views, PDF and ePub downloads, according to the available data) and Abstracts Views on Vision4Press platform.
Data correspond to usage on the plateform after 2015. The current usage metrics is available 48-96 hours after online publication and is updated daily on week days.
Initial download of the metrics may take a while.