Fig. 17
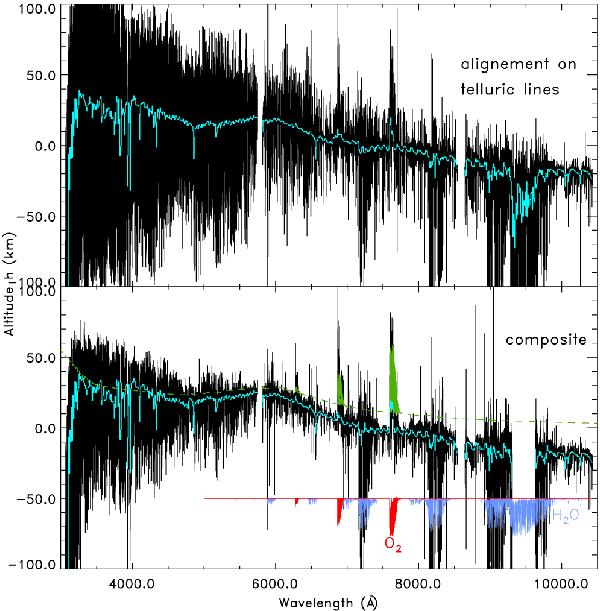
Altitude profile with UVES and method 2. A 10 Å bin is superimposed in light-blue on the full-resolution profile. The upper panel shows the profile obtained with the UVES spectra aligned on the telluric lines, with solar lines consequently slightly misaligned and thus generating noise in h. The lower panel shows a composite profile showing the profile aligned on the solar lines when no telluric line is present, and the profile aligned on the telluric lines when a telluric line is present. Oxygen and water-vapour absorption spectra at arbitrary scale are shown to facilitate the identification of the spectral lines. The model of Ehrenreich et al. (2006) is shown in green.
Current usage metrics show cumulative count of Article Views (full-text article views including HTML views, PDF and ePub downloads, according to the available data) and Abstracts Views on Vision4Press platform.
Data correspond to usage on the plateform after 2015. The current usage metrics is available 48-96 hours after online publication and is updated daily on week days.
Initial download of the metrics may take a while.