Fig. 15
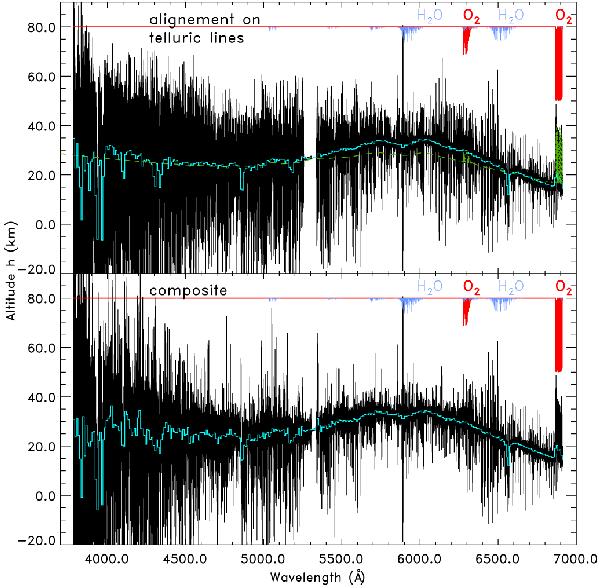
Altitude profile with HARPS and Eq. (3) (method 2). Only the spectrum of the deepest penumbra, taken at 66 arcsec from the umbra, is used here (Table 3). Shallower penumbra spectra give similar but noisier profiles. A 10 Å bin is superimposed in light-blue on the full-resolution profiles. The upper panel shows the profile obtained with the HARPS spectra aligned on the telluric lines. Solar lines are consequently slightly misaligned and generate noise in the profile. The lower panel shows a composite profile showing the profile calculated with the spectra aligned on the telluric lines, expect when a solar line is present, where the profile from spectra aligned on the solar lines is used. Oxygen and water-vapour absorption spectra at arbitrary scale are shown. The green dashed line is the model of Ehrenreich et al. (2006).
Current usage metrics show cumulative count of Article Views (full-text article views including HTML views, PDF and ePub downloads, according to the available data) and Abstracts Views on Vision4Press platform.
Data correspond to usage on the plateform after 2015. The current usage metrics is available 48-96 hours after online publication and is updated daily on week days.
Initial download of the metrics may take a while.