Fig. 12
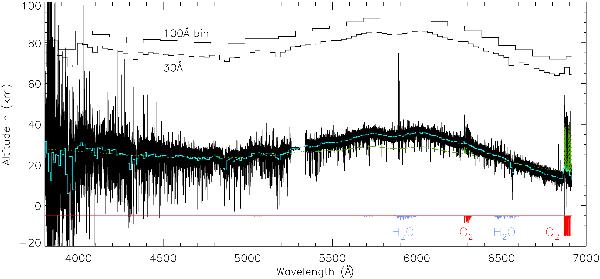
Final altitude profile obtained with HARPS, method 1, and with a Noxon correction for the Ring effect, expect in the deep telluric lines (Sioris & Evans 2000). A 10 Å bin is superimposed in light-blue over the full-resolution profile; 30 and 100 Å bins are shown too, shifted upwards for clarity. The Na I peaks are visible near 5900 Å. Oxygen and water-vapour absorption spectra at arbitrary scale are shown. The altitude profile has been shifted to have an altitude of 23.8 km in the [4520–4540] Å domain, as predicted by Ehrenreich et al. (2006) (dots and dashes in green – dashes to improve the visibility of the curve around 6000 Å).
Current usage metrics show cumulative count of Article Views (full-text article views including HTML views, PDF and ePub downloads, according to the available data) and Abstracts Views on Vision4Press platform.
Data correspond to usage on the plateform after 2015. The current usage metrics is available 48-96 hours after online publication and is updated daily on week days.
Initial download of the metrics may take a while.