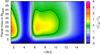
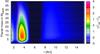
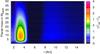
Fig. 6

Torque acting on discs with different Ṁ and metallicity, with 5 × 10⁻⁸ M⊙/yr and 0.02 metallicity (top), 1 × 10⁻⁸ M⊙/yr and 0.03 metallicity (middle) and 5 × 10⁻⁹ M⊙/yr and 0.05 metallicity (bottom). The black lines encircle the regions of outward migration. The vertical red lines indicate the ice line at 170 K. The migration maps correspond to the disc profiles shown in Fig. 5.
Current usage metrics show cumulative count of Article Views (full-text article views including HTML views, PDF and ePub downloads, according to the available data) and Abstracts Views on Vision4Press platform.
Data correspond to usage on the plateform after 2015. The current usage metrics is available 48-96 hours after online publication and is updated daily on week days.
Initial download of the metrics may take a while.