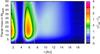
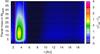
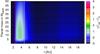
Fig. 4

Torque acting on discs with different Ṁ, with 5 × 10⁻⁸ M⊙/yr (top), 1 × 10⁻⁸ M⊙/yr (middle) and 5 × 10⁻⁹ M⊙/yr (bottom) for the applied Paardekooper et al. (2011) formula. The black lines encircle the regions of outward migration for the Paardekooper et al. (2011) formula. The vertical solid yellow lines mark the outer edge of the zero-migration region for the unsaturated torques (Paardekooper et al. 2010), while the dashed-yellow line marks the inner edge of the zero migration region of the unsaturated torques. The vertical red lines indicate the ice line at 170 K.
Current usage metrics show cumulative count of Article Views (full-text article views including HTML views, PDF and ePub downloads, according to the available data) and Abstracts Views on Vision4Press platform.
Data correspond to usage on the plateform after 2015. The current usage metrics is available 48-96 hours after online publication and is updated daily on week days.
Initial download of the metrics may take a while.