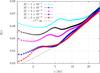
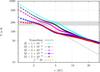
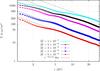
Fig. 3

H/r-profile (top), temperature (middle) and surface density profile (bottom) of discs with different Ṁ rates. The profile is taken when the discs have reached their radially constant Ṁ rate. The black dotted lines represent power-law fits to guide the eyes. The grey area in the temperature plot marks the temperature range where the opacity profile changes due to the melting of ice grains (see Fig. 1). Please note that we cut the displayed disc at 30 AU to enhance the details in the inner parts of the disc.
Current usage metrics show cumulative count of Article Views (full-text article views including HTML views, PDF and ePub downloads, according to the available data) and Abstracts Views on Vision4Press platform.
Data correspond to usage on the plateform after 2015. The current usage metrics is available 48-96 hours after online publication and is updated daily on week days.
Initial download of the metrics may take a while.