Fig. 6
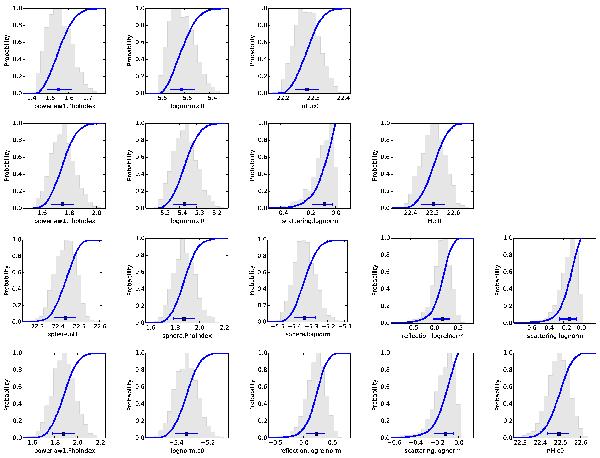
Marginalised parameters of the wabs (top), wabs+scattering, sphere+pexmon+scattering and wabs+pexmon+scattering model (bottom) for source 179. The posterior probability density distribution, normalised to the maximum, is shown by grey bars. The blue line indicates the cumulative posterior distribution. For summary of the error, the median and 10/90% quantiles can be used, or as the blue error bar indicates, the 1 standard-deviation equivalent probabilities.
Current usage metrics show cumulative count of Article Views (full-text article views including HTML views, PDF and ePub downloads, according to the available data) and Abstracts Views on Vision4Press platform.
Data correspond to usage on the plateform after 2015. The current usage metrics is available 48-96 hours after online publication and is updated daily on week days.
Initial download of the metrics may take a while.