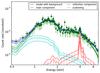
Fig. 5
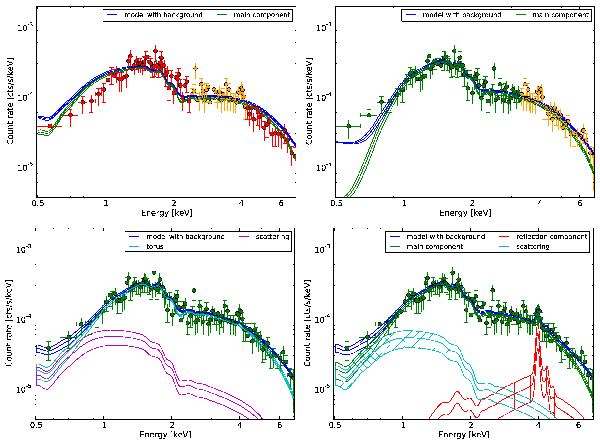
Observed (convolved) spectrum of object 179, binned for plotting to 10 counts per bin. Shown are analyses using various models and their individual components: powerlaw (upper left), wabs (upper right), torus+scattering (lower left) and wabs+pexmon+scattering (lower right). The posterior of the parameters are used to compute the median and 10%-quantiles of each model component.
Current usage metrics show cumulative count of Article Views (full-text article views including HTML views, PDF and ePub downloads, according to the available data) and Abstracts Views on Vision4Press platform.
Data correspond to usage on the plateform after 2015. The current usage metrics is available 48-96 hours after online publication and is updated daily on week days.
Initial download of the metrics may take a while.