Fig. C.1
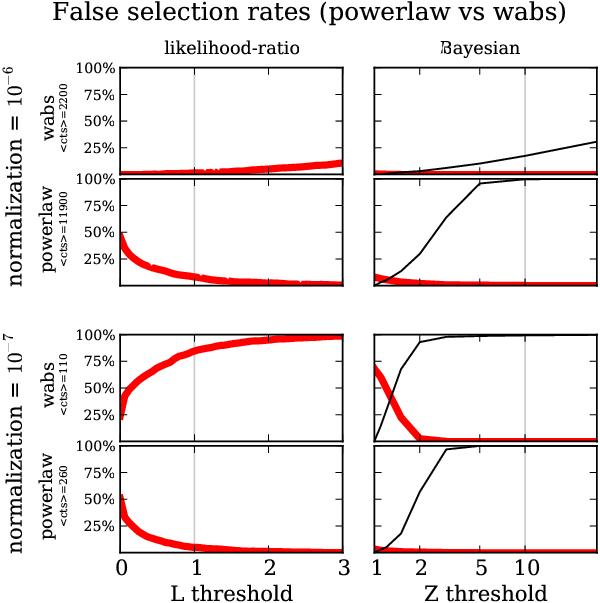
Model selection results between powerlaw and wabs. Likelihood-ratio based methods (left panels) and Bayesian model selection (right panels) show different fractions of false choices decisions (thick red line). The top left plot for example shows the fraction of generated spectra where the likelihood ratio method selected powerlaw instead of the model used for generating the spectrum, wabs. The plot below should be considered simultaneously, as it shows the fraction where powerlaw was selected in spectra generated with wabs. Results are shown in dependence of the threshold applied. The threshold may be optimised, but typical choices are ΔL = 1 from AIC and log 10 = 1 for the Bayes factor if the model priors are equal (gray vertical lines). Considering the sum of thick red lines in panel pairs, the Bayesian model selection has a false selection rate below 1% at the marked threshold, which can not be achieved using likelihood-ratios regardless of the threshold chosen. The Bayesian model selection may decline to decide due to insufficient discriminatory power of the data (thin black line). This is the case for the faint normalisations (bottom four panels), where the likelihood-ratio methods remain with the simpler model (yielding an error of ~50%). In the brighter normalisations (upper right panels), the Bayesian method beyond a threshold of 5 declines to distinguish when the powerlaw model was used to generate the data. This is a consequence of the degeneracy between the nested powerlaw and wabs models. Thus for nested models, a lower threshold, such as Δlog Z = log 3 = 0.5 can be appropriate. When considering the efficiency only, the likelihood ratio based method yields more correct decisions, as the Bayesian method declines to choose very often. However, one may also remain with the simpler model, in which case the results would be comparable.
Current usage metrics show cumulative count of Article Views (full-text article views including HTML views, PDF and ePub downloads, according to the available data) and Abstracts Views on Vision4Press platform.
Data correspond to usage on the plateform after 2015. The current usage metrics is available 48-96 hours after online publication and is updated daily on week days.
Initial download of the metrics may take a while.