Fig. B.2
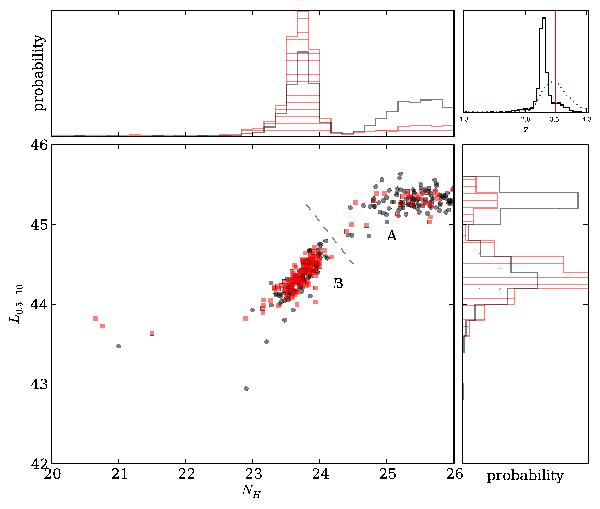
Demonstration of parameter estimation results under different redshift inputs. Source 551 in the catalogue is analysed twice with the methodology laid out in this paper using the torus model. We consider once the case of using only the best fit photometric redshift and once the case of using the photometric redshift probability distribution (PDZ). Both inputs are shown in the upper right panel as a vertical red line at z = 3.5444 and with a dotted green line respectively. For brevity, only two resulting parameters are presented, namely the column density NH (logarithmic, in cm-2) and the derived intrinsic luminosity L in the 0.5−10 keV band (logarithmic, in erg / s). The large, lower left panel shows the derived intrinsic luminosity and column density parameters by equally probable points, similar to a Markov chain. As each point on the plane is equally likely to be the true value, denser regions represent more probable parameter values. Here, the red squares represent the fixed redshift analysis while the black circles show the analysis results using the PDZ. The marginal distributions are shown in the upper left and lower right panels as probability histograms (red crossed hatching and black striped hatching). Two separated solutions are clearly visible and highlighted using the labels “A” for the highly obscured solution and “B” for the less obscured solution. The associated spectra are illustrated in Fig. B.1. The fixed redshift analysis has the highest likelihood at the less obscured solution. When given the freedom to vary the redshift parameter, the X-ray data have the highest likelihood at the highly obscured solution. Maximum Likelihood analysis methods thus may fail to account for the uncertainty (see text). The difference in results come from the freedom to move to a lower redshift, as can be seen in the upper right panel, where the black line shows the redshift posterior probability distribution. These results thus also show that redshift information can be improved using X-ray data (see Buchner et al., in prep.).
Current usage metrics show cumulative count of Article Views (full-text article views including HTML views, PDF and ePub downloads, according to the available data) and Abstracts Views on Vision4Press platform.
Data correspond to usage on the plateform after 2015. The current usage metrics is available 48-96 hours after online publication and is updated daily on week days.
Initial download of the metrics may take a while.