Fig. B.1
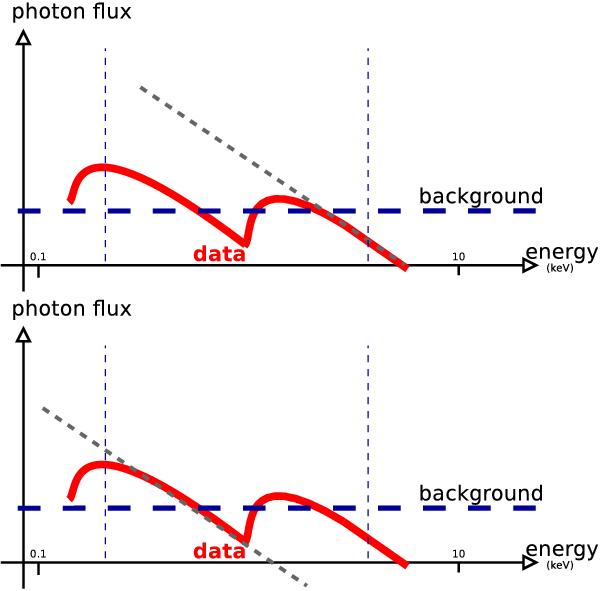
Origin of the two distinct solutions in Fig. B.2 is highlighted in these two cartoons. Given the data shown in the red thick line, one can either A) consider a bright, highly obscured source (top panel), or B) a low-luminosity, low-obscuration solution where the hard counts are due to the background. An intermediate solution is ruled out however. Depending on the background level and redshift, the two solutions will have different likelihoods.
Current usage metrics show cumulative count of Article Views (full-text article views including HTML views, PDF and ePub downloads, according to the available data) and Abstracts Views on Vision4Press platform.
Data correspond to usage on the plateform after 2015. The current usage metrics is available 48-96 hours after online publication and is updated daily on week days.
Initial download of the metrics may take a while.