Fig. 11
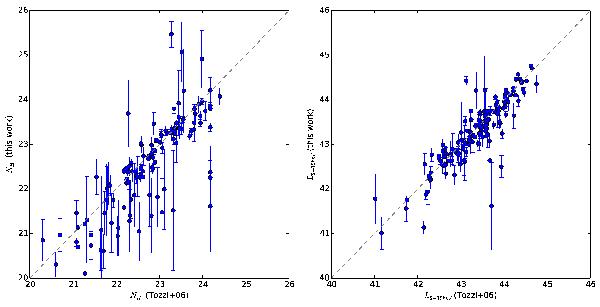
Comparison of the derived column density (left panels, NH, here in logarithmic) and intrinsic luminosity (right panel, logarithmic, in erg / s for the 2−10 keV rest frame band) with the analysis of Tozzi et al. (2006). We selected only objects from our sample which have the same redshift in Tozzi et al. (2006) and this work. We plot the median and 1-sigma equivalent quantiles of the posterior in our analysis against the best fit found in Tozzi et al. (2006). There are important differences between the works. The Tozzi et al. (2006) analysis is based on only the first 1Ms data, and thus has much fewer counts. Furthermore, only simple absorption models have been considered in their maximum likelihood fitting.
Current usage metrics show cumulative count of Article Views (full-text article views including HTML views, PDF and ePub downloads, according to the available data) and Abstracts Views on Vision4Press platform.
Data correspond to usage on the plateform after 2015. The current usage metrics is available 48-96 hours after online publication and is updated daily on week days.
Initial download of the metrics may take a while.