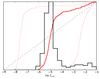
Fig. 10
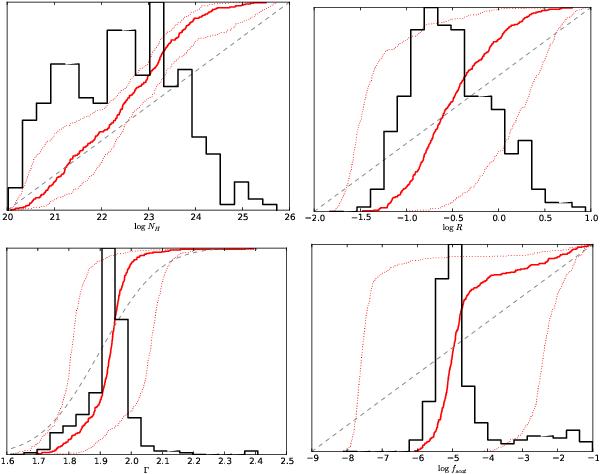
Histograms of the best parameter values derived using the torus+pexmon+scattering model. The median of the marginal posterior distribution for each object is histogrammed in black. The thick red line shows the same as a cumulative distribution. To illustrate the uncertainty in the parameters, the dotted red lines show the cumulative distribution of the 10% and 90% quantiles instead of the median. The dashed gray line shows the used prior.
Current usage metrics show cumulative count of Article Views (full-text article views including HTML views, PDF and ePub downloads, according to the available data) and Abstracts Views on Vision4Press platform.
Data correspond to usage on the plateform after 2015. The current usage metrics is available 48-96 hours after online publication and is updated daily on week days.
Initial download of the metrics may take a while.