Fig. 9
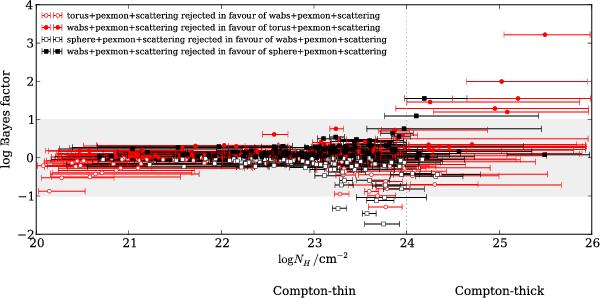
Evidence contribution from each source with secure spectroscopic redshift. The vertical axis shows the Bayes factor between torus+pexmon+scattering and wabs+pexmon+scattering (red circles), where strong preference for the torus is above log 10 = 1. The same is shown for sphere+pexmon+scattering and wabs+pexmon+scattering (black squares). In both model comparisons, there are obscured objects showing significant preference for either model.
Current usage metrics show cumulative count of Article Views (full-text article views including HTML views, PDF and ePub downloads, according to the available data) and Abstracts Views on Vision4Press platform.
Data correspond to usage on the plateform after 2015. The current usage metrics is available 48-96 hours after online publication and is updated daily on week days.
Initial download of the metrics may take a while.