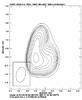
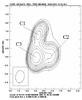
Fig. 7
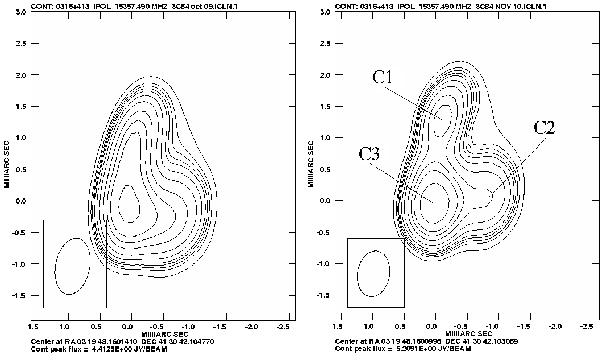
MOJAVE images of 3C 84 at 15 GHz in October 2009 (left) and November 2010 (right). The contours are plotted at levels of (0.5, 0.7, 0.8, 0.9, 1, 1.2, 1.5, 2, 2.5, 3, and 4) Jy/beam. The labels C1, C2, and C3 show the three bright components in the central region. The insets show the shape of the PSF.
Current usage metrics show cumulative count of Article Views (full-text article views including HTML views, PDF and ePub downloads, according to the available data) and Abstracts Views on Vision4Press platform.
Data correspond to usage on the plateform after 2015. The current usage metrics is available 48-96 hours after online publication and is updated daily on week days.
Initial download of the metrics may take a while.