Fig. 6
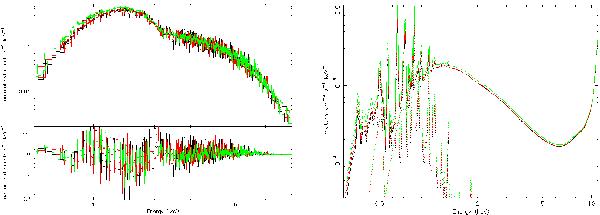
Energy spectra of the NGC 1275 nuclear emission from the three large offset Chandra observations (ObsId 11025-green, 12033-red, 12036-black) and the fit models with fixed power-law index Γ = 2.5. In the top left panel, crosses show the photon rates per energy bin grouped to have at least 25 counts/bin and the solid lines show the fit models. In the bottom left panel, the fit residuals are reported. The right-hand panel shows the photon flux energy spectra of the fit models. Dashed lines represent the different model components (mekal and powerlaw after absorption and pileup effect) and the solid lines are the total. The large tail at high energy is a consequence of the pileup modeling.
Current usage metrics show cumulative count of Article Views (full-text article views including HTML views, PDF and ePub downloads, according to the available data) and Abstracts Views on Vision4Press platform.
Data correspond to usage on the plateform after 2015. The current usage metrics is available 48-96 hours after online publication and is updated daily on week days.
Initial download of the metrics may take a while.