Fig. 4
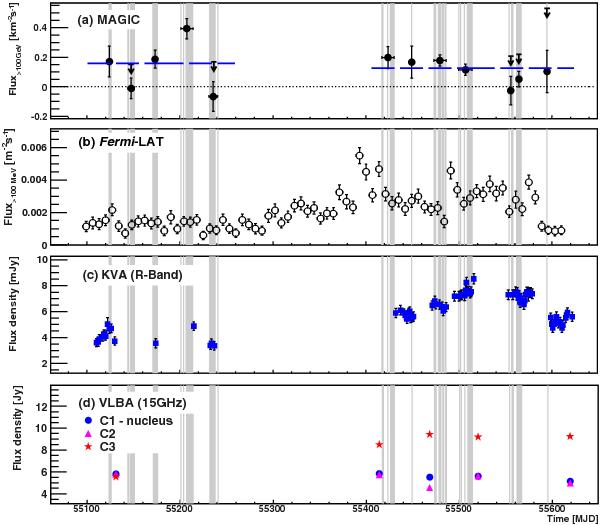
Multifrequency light curves of NGC 1275 from October 2009 to February 2011. The vertical gray lines show the exact observation dates with MAGIC. a) The MAGIC LC above 100 GeV in monthly bins. The thick dashed lines represent the constant fit for both observation campaigns. For data showing an excess <1σ, upper limits (black arrows) are calculated assuming a spectral index Γ = 4.0, using the Rolke et al. 2005 method with a confidence level of 95% and a total systematic uncertainty of 30%. b) The Fermi-LAT LC above 100 MeV has a weekly binning. c) The KVA R-band LC shows the core continuum flux corrected for Galactic extinction. The constant systematic error (±0.6 mJy) induced by the host-galaxy and emission-line subtraction is not included in the error bars. d) The VLBA LCs show the 15 GHz emission from the three innermost components of the radio jet.
Current usage metrics show cumulative count of Article Views (full-text article views including HTML views, PDF and ePub downloads, according to the available data) and Abstracts Views on Vision4Press platform.
Data correspond to usage on the plateform after 2015. The current usage metrics is available 48-96 hours after online publication and is updated daily on week days.
Initial download of the metrics may take a while.