Fig. 10
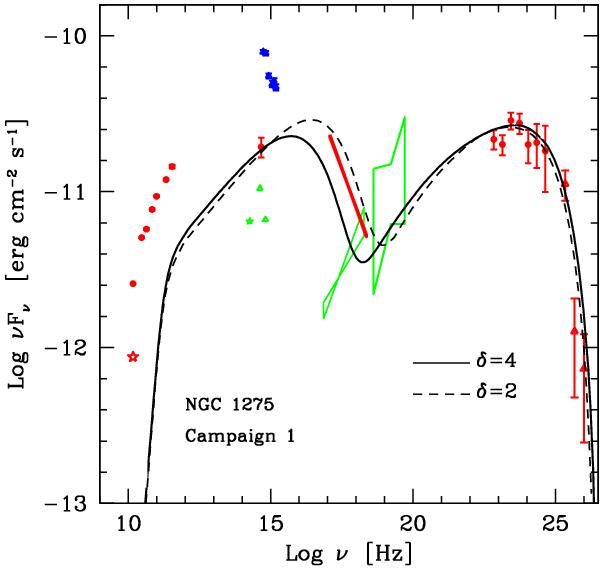
NGC 1275 SED for the epoch of Camp. 1 (October 2009-February 2010). Red symbols show nearly simultaneous data from MOJAVE, KVA, Chandra (when assuming a power-law slope Γ = 2.5), Fermi-LAT, and MAGIC. Contemporaneous Planck data from the Planck Collaboration (2011) are also shown with red circles. The red star in radio shows the level of the individual subparsec components (C1, C2, and C3 have nearly the same flux). Green bow-ties in the X-ray band report the archival Chandra and Swift-BAT results from Balmaverde et al. (2006) and Ajello et al. (2009), respectively. Green symbols report optical-IR measurement by HST from Chiaberge et al. (1999) (triangles) and Baldi et al. (2010) (star). The blue points show the August 2010 Swift-UVOT data from Giommi et al. (2012) (corrected for the host galaxy contribution). The dashed and solid lines report the SSC models for δ = 2 (θv < 30°) and δ = 4 (θv < 15°), respectively.
Current usage metrics show cumulative count of Article Views (full-text article views including HTML views, PDF and ePub downloads, according to the available data) and Abstracts Views on Vision4Press platform.
Data correspond to usage on the plateform after 2015. The current usage metrics is available 48-96 hours after online publication and is updated daily on week days.
Initial download of the metrics may take a while.