Fig. 1
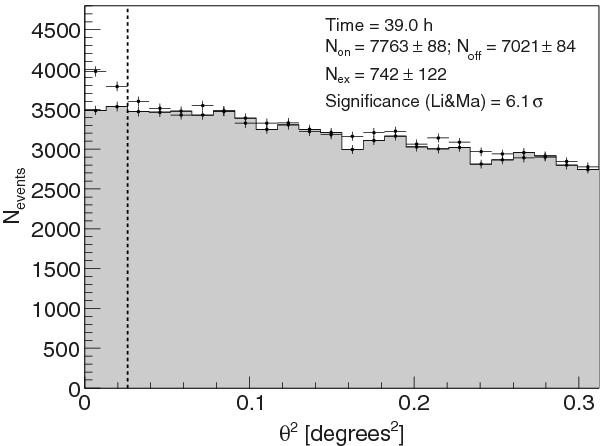
θ2 distributions of the NGC 1275 signal and background estimation from 39.0 h of MAGIC stereo observations taken between October 2009 and February 2010, in soft-trigger stereo mode (see 2.1) with an energy threshold of 100 GeV. The region between zero and the vertical dashed line (at 0.026 degrees2) represents the signal region.
Current usage metrics show cumulative count of Article Views (full-text article views including HTML views, PDF and ePub downloads, according to the available data) and Abstracts Views on Vision4Press platform.
Data correspond to usage on the plateform after 2015. The current usage metrics is available 48-96 hours after online publication and is updated daily on week days.
Initial download of the metrics may take a while.